

Navigation
Every default indicator on your chart -- EMA, RSI, MACD -- exists on every other platform too. The AEON group is a separate set of overlays built to read order flow, absorption and momentum agreement the way AEON's own signal engine does.
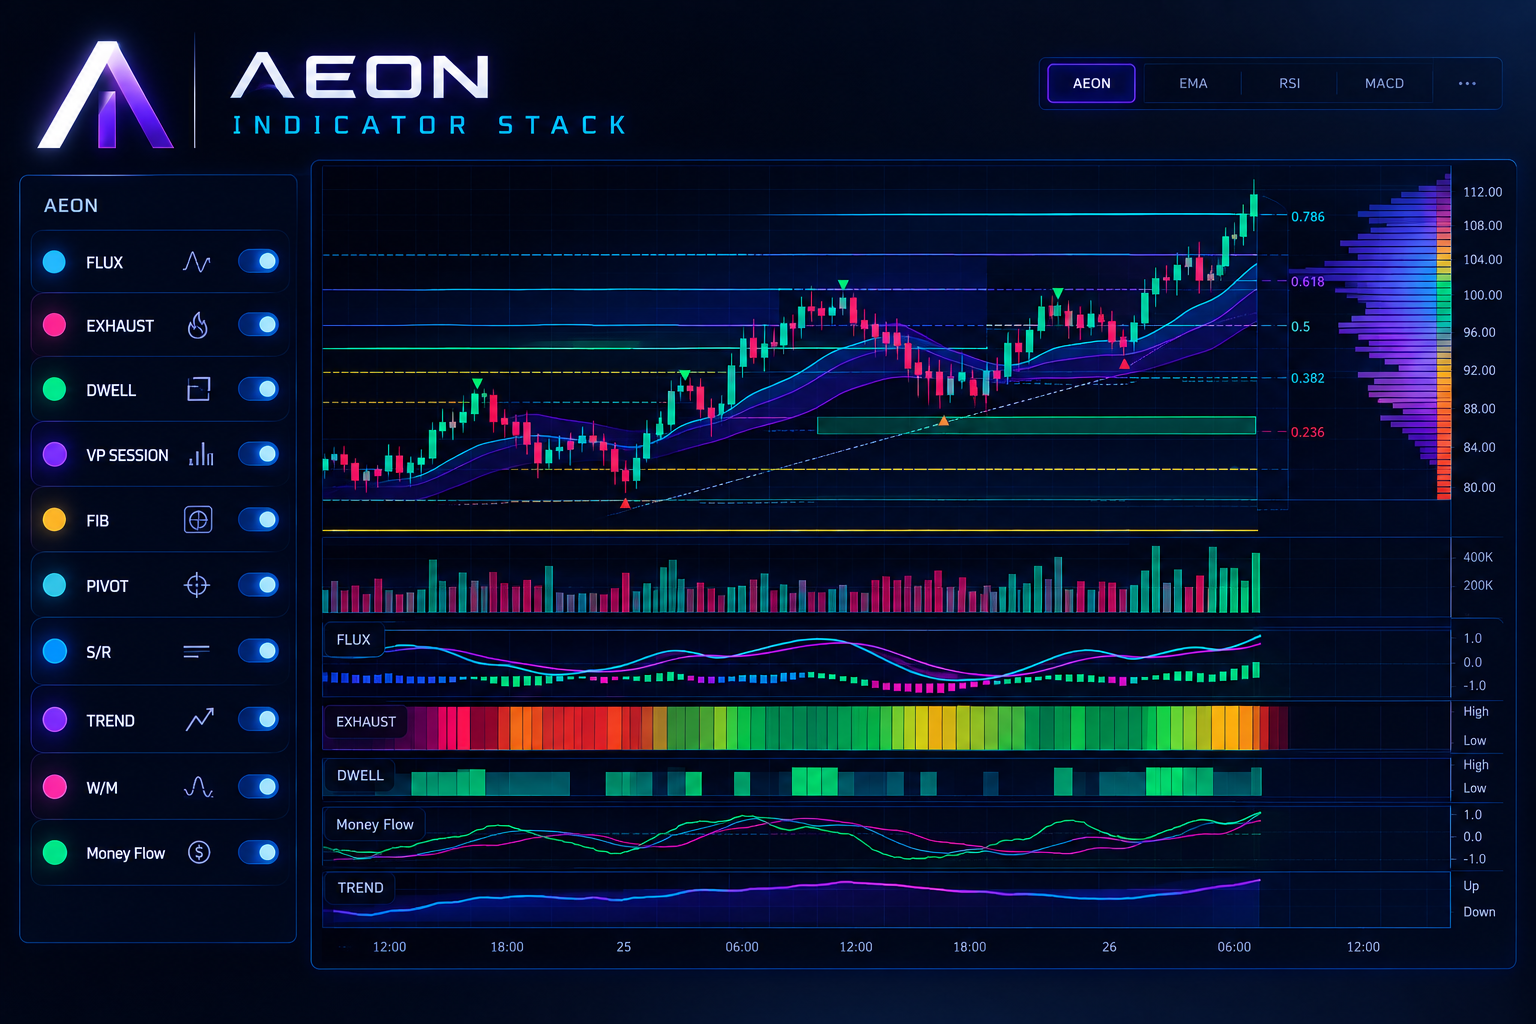
The chart toolbar has two indicator groups: DEFAULT (the familiar set -- EMA, Bollinger Bands, VWAP, RSI, MACD, ADX, OBV) and AEON, a separate stack built around order flow, absorption and multi-factor agreement rather than price alone. Switching groups swaps the whole indicator strip; both groups apply to whichever chart panel you're currently editing.
Money Flow -- combines CVD, order-book pressure, volume ratio, and a whale/mid/retail flow split into one read of who's actually driving price.
Per-candle delta overlay -- tints each candle body by its buy vs. sell volume split, so aggressive-side pressure is visible at a glance without a separate panel.
Dwell Blocks -- flags order-flow absorption zones where resting orders visibly stalled price, a chart-level companion to the MM Monitor's CVD divergence read.
A heat strip along the price axis combining CVD divergence, delta flips, wick rejection, RSI extremes and distance from the volume POC into one exhaustion intensity read per price level.
A momentum-pressure gradient checking whether price, volume and delta acceleration all agree. Three-way agreement is built to catch exhaustion or breakout acceleration before price itself confirms it.
An adaptive trend-state overlay marking the current directional bias directly on the chart, independent of any single moving average.
Automatically plotted support and resistance levels derived from price structure, updated as new swing points form.
Adaptive multi-scale pattern detection for W and M-shaped reversal structures (double bottoms/tops and their variants) across timeframes.
Fibonacci retracement & extension with automatic swing high/low detection that adapts per timeframe, a shaded golden-zone fill, and levels from 0.236 through 2.618.
Pivot points (PP, R1-R3, S1-S3) in Standard, Fibonacci, Woodie or Camarilla flavors, resolved at daily, weekly or monthly resolution.
Session Range Boxes marking Tokyo, London and New York session highs and lows directly on the chart, so you can see which session set the current range.
Volume Profile split by session -- NY, London and Asia each get their own shaded range, horizontal volume bars, and point-of-control (POC) line, toggleable independently.
Individually, each of these is a narrow read. Combined, they're closer to how the signal engine itself thinks: a FLUX momentum-agreement signal that lines up with a DWELL absorption zone sitting right on a VP SESSION point of control is a materially stronger confluence than any single one of those triggering alone. The stack is built to be layered, not cherry-picked -- start with two or three that match your timeframe and trading style rather than turning on everything at once.
MFLOW's CVD input and DWELL's absorption logic are the same underlying reads covered in more depth in CVD divergence, explained and spoofing vs. real divergence.
Indicators describe conditions, not certainties. Every overlay in this stack is a probabilistic read of order flow and structure -- treat confluence between several of them as increased conviction, not confirmation, and size positions with your own risk management.